> For the complete documentation index, see [llms.txt](https://usermanuals.geojit.com/llms.txt). Markdown versions of documentation pages are available by appending `.md` to page URLs; this page is available as [Markdown](https://usermanuals.geojit.com/flip-mobile/security-page/overview.md).
# Overview
###
### This section contains:
1. [Market By Price (MBP)](#id-1.-market-by-price-mbp)
2. [Daily Market Data](#id-2.-daily-market-data)
3. [Geojit Sentimeter](#id-3.-geojit-sentimeter)
4. [Pivot Range](#id-4.-pivot-range)
5. [Bulk & Block Deals](#id-5.-bulk-and-block-deals)
6. [Announcements](#id-6.-announcements)
7. [Company News](#id-7.-company-news)
8. [Pin to Market Overview](#id-8.-pin-to-market-overview)
See information such as "**Market By Price"**(MBP), **"Horizontal Bar Charts"**, "**Geojit Sentiment"**, "**Deals"**, "**Company News"**, and "**Pin to Market Overview".**
### 1. Market By Price(MBP)
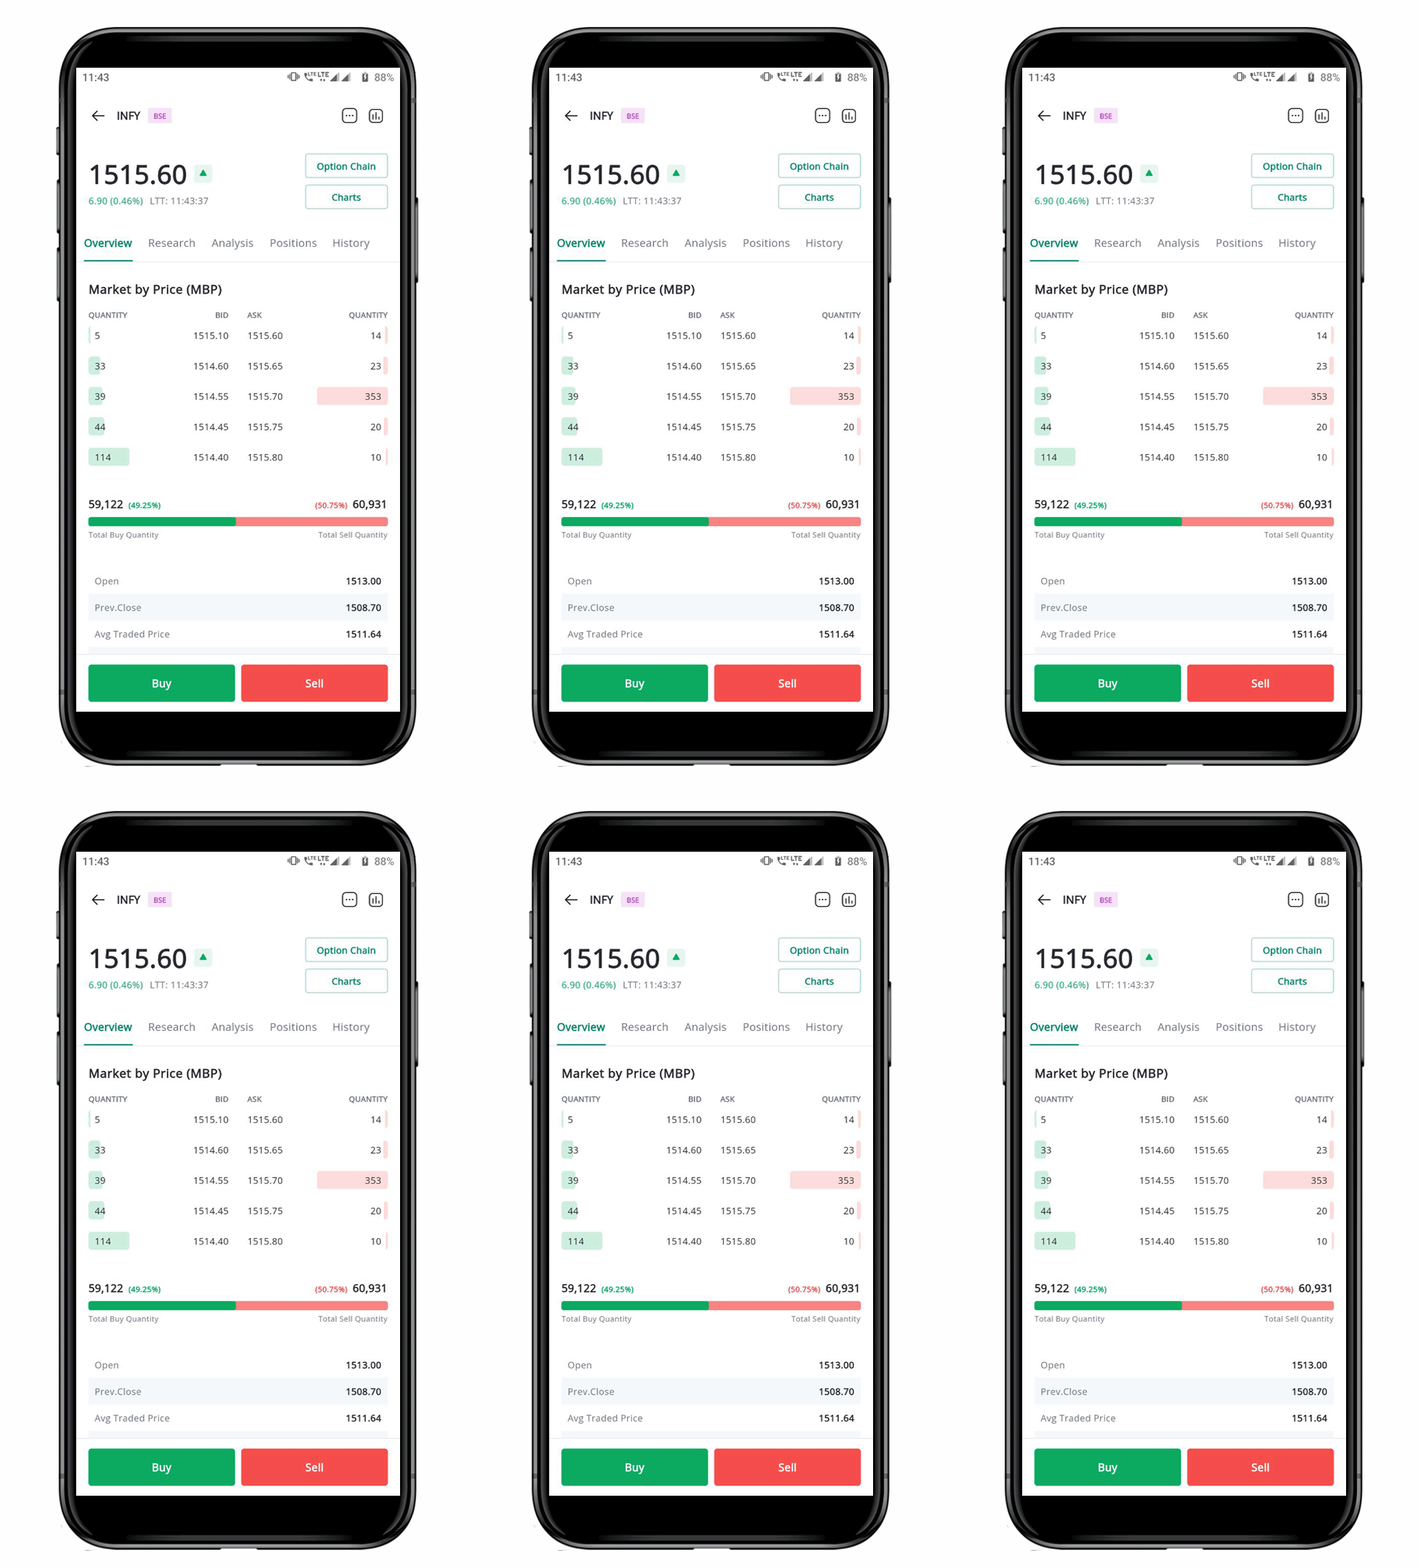
* "**Market By Price"** provides real-time information on the *bid* and *ask* prices for a security, along with the available *Quantity* for each price.
* The "**MBP"** display provides valuable information for Investors.
* In addition, to *bid* and *ask* prices, "**MBP"** data also includes a "**Horizontal Bar Chart".**
* The "**Horizontal Bar Chart"** displays the **Total Buy** and **Sell Quantities,** and the **Percentage of Total Buy** and **Sell Quantity,** allowing you to quickly see the ratio of *buy-to-sell orders*.
#### SLBM (Securities Lending and Borrowing Mechanism)
* **Live SLBM rates** are available and integrated into the **mobile application** for user reference.
* **Order Placement Restriction:** Currently, **order placement for SLBM is not enabled on the mobile platform**.
* To execute SLBM transactions, users must **place orders through the Call Centre**.
### 2. Daily Market Data
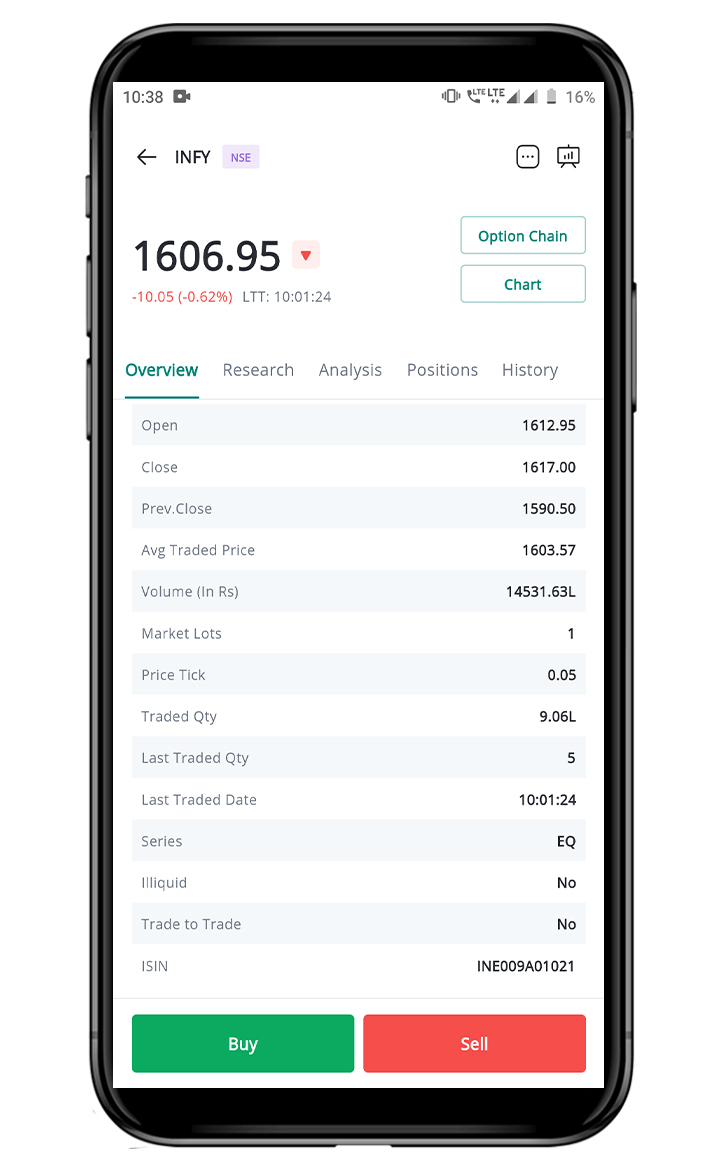
**"Daily Market Data"** is a collection of information about the performance of a particular security on a given day. It includes details such as the **Opening & Closing Price, Volume, Traded Quantity,** and **Other Metrics** that can help you understand the Security's performance and make informed decisions about buying or selling it.
### 3. Geojit Sentimeter
The **Horizontal Bar Charts** represent the **total buy** and **sell order quantities** placed by Geojit’s customers for a particular security (including **both executed** and **pending orders**).
* The **Geojit Sentimeter Bar** is a tool that displays information about the **buy** and **sell order activity** for a given security (**executed and pending**).
* **First Bar** shows the **total order quantity**—**both** **executed** and **pending**—that was placed by Geojit’s clients on a given day, with the **buy**-order share in **green** and the **sell**-order share in **red**.
* **Second Bar** shows the **percentage of Geojit’s clients** who placed **buy orders versus** those who placed **sell orders** on that day, with **buy** percentages in **green** and **sell** percentages in **red**.
* This information helps investors gauge **overall client sentiment** toward a security and make more informed decisions.
### 4. Pivot Range
* **Pivot Range** helps you assess the overall market sentiment.
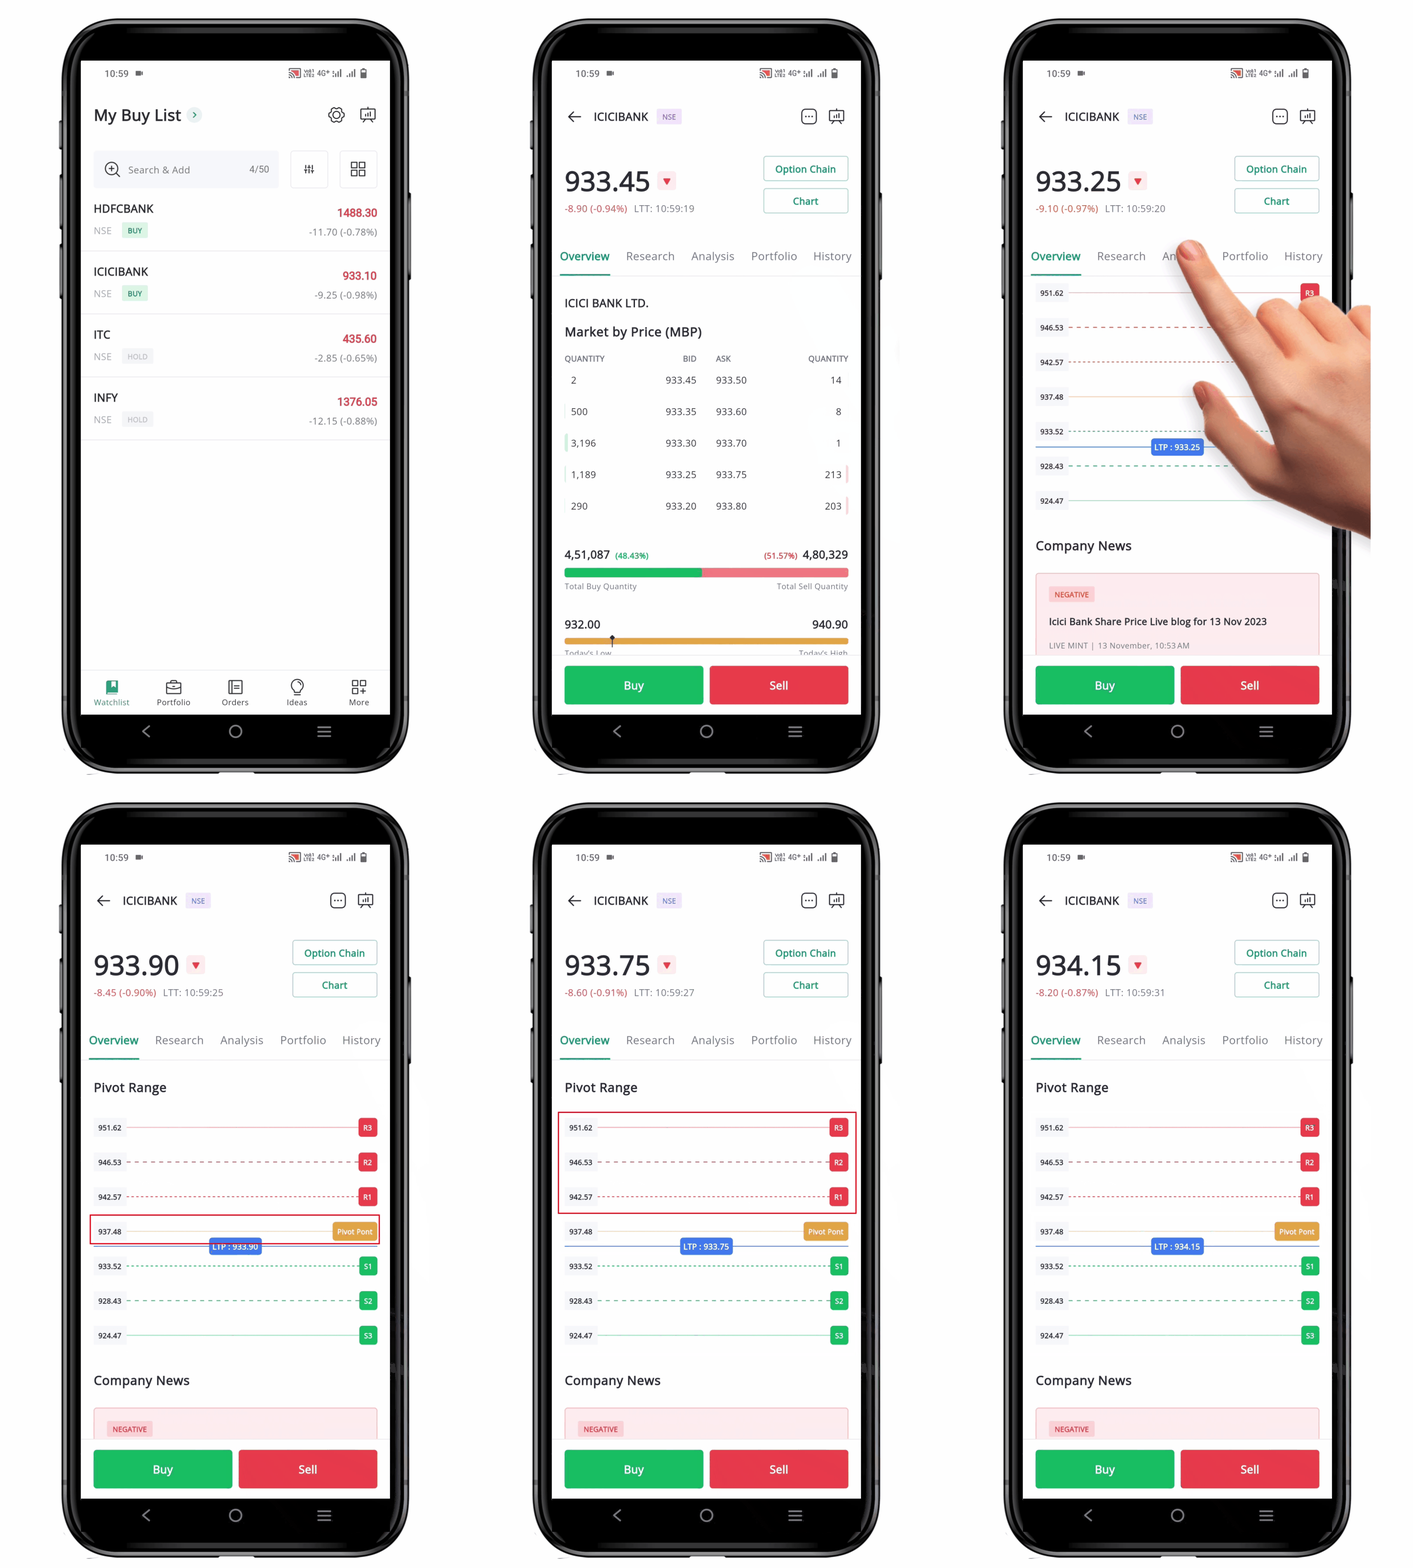
* To access the **"Pivot Points", "Support",** and **"Resistance"** information about a specific security, go to the Security Page of that particular security.
* On the Overview tab, scroll down to see the "**Pivot Range"** of that security.
* **"Pivot Range"** is a graphical representation that shows **"Pivot Price", "Three Support Levels",** and **"Three Resistance Levels".**
* You can also see the **"Current Trading Price".**
### 5. Bulk & Block Deals
* **"Block Deals"** and **"Bulk Deals"** are a common way for institutional investors to *trade large Quantities* of securities without disrupting the market.
* Because these trades are executed outside the regular Trading Channels, they can be completed quickly and efficiently without affecting the **Market Price** of the securities.
* **Deal Sections** under Securities Page provides information about the *size, price,* and *other details* of recent & past **"Block and Bulk Deals"** of that security.
* Overall, the **Deal Section** can be a useful tool for investors looking to make informed decisions about their trades.
* *For example*, if a deal section shows a large **Block Trade** of a certain security being *sold* by a hedge fund, it could indicate that the fund is bearish on the security and that investors should be cautious when considering buying it.
### 6. Announcements
**"Announcement section"** helps you to stay updated about any upcoming **Corporate Actions or Events.** Under **Announcement** you can see the **"Event Details", "Ex Date"** and the **"Record Date".**
### 7. Company News
* In the **"News Section"**, you are provided with comprehensive information about *media news* related to a specific security.
* This includes **"News"** from the *current* and *previous few days,* allowing you to stay up-to-date on the latest developments.
* Each **"News"** item is carefully *analyzed and rated* as **Bullish, Bearish,** or **Neutral** based on its sentiment, giving investors valuable insight into the potential impact on the security.
* With this information, you can make more *informed investment decisions* and potentially *maximize* the returns.
### 8. Pin to Market Overview
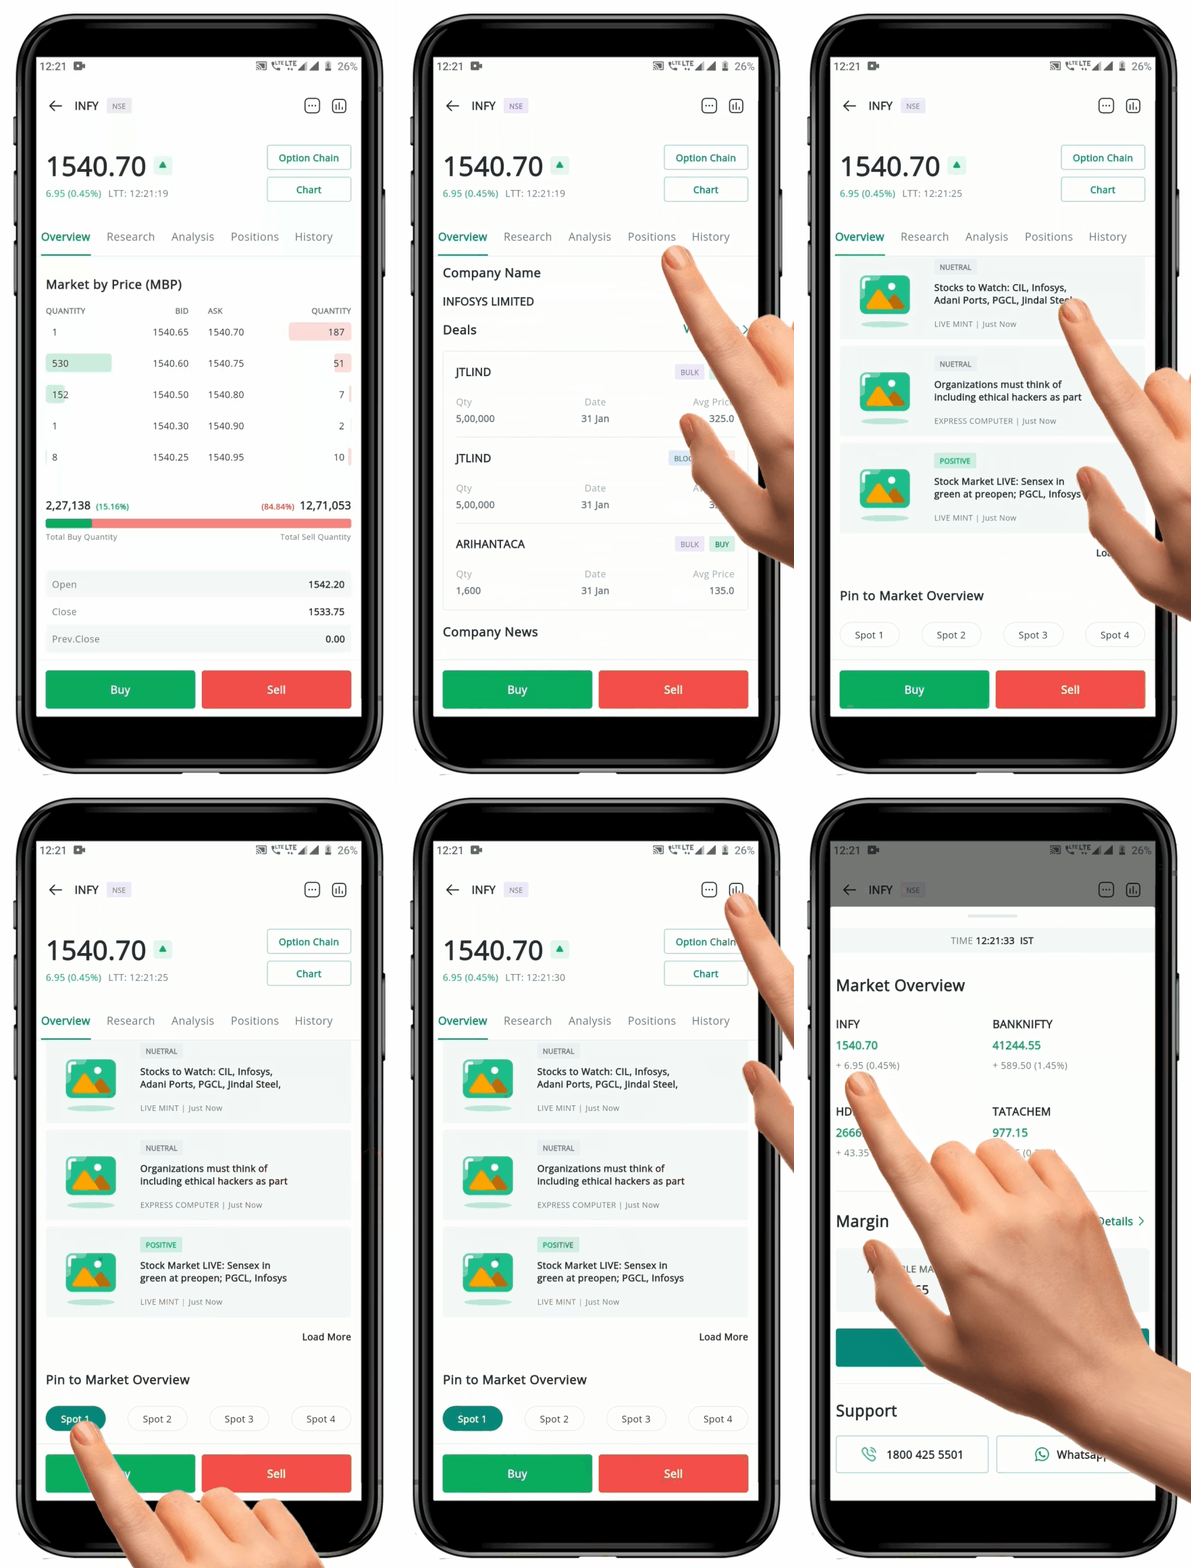
To "**Pin"** a particular security to the **Overview Page** from the **Security page,** follow these steps:
* Go to the **"Pin to Overview"** section of the **Security page.**
* To pin the Security, click on any one of the four options labelled as **"Spot 1"** to **"Spot 4"** to select the desired location on the **Overview Page.**
* "**Pin to Market Overview"** will allow you to quickly access the selected security from the **Overview Page.**
**Please Note:** It is recommended not to select the same security for more than one spot.